
Why inspect a page?
- Debugging: find broken DOM, CSS specificity issues, JS errors
- Performance: spot slow network requests, heavy scripts, memory leaks
- Accessibility & SEO: verify semantic markup, ARIA, headings and meta tags
- Learning & reverse‑engineering: understand layout patterns, CSS tricks and JS behavior
- Rapid prototyping: live-edit HTML/CSS and test fixes without redeploying
How to open Developer Tools
- Keyboard shortcut: F12 or Ctrl+Shift+I (Cmd+Opt+I on macOS)
- Right‑click any element → Inspect Element
- Menu: Tools → Web Developer → Web Developer Tools
- Remote: about:debugging → Connect to device / Firefox instance
Overview of built‑in DevTools
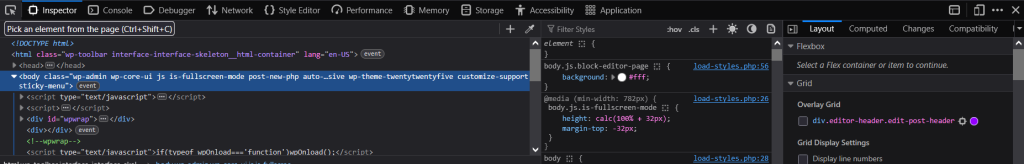
- Inspector (Page Inspector)
- View/edit DOM and CSS rules, computed styles, box model and layout
- Use: layout bugs, specificity problems, CSS experiments
- Features: element picker, rule search, style editing, box model overlays, CSS variables preview
- Box Model & Layout tools
- Visual margins/padding/border overlays; Grid and Flexbox highlighters
- Use: debug spacing, alignment, grid gaps
- Fonts panel
- See used webfonts, font-face declarations, fallback chain, line-height, weight
- Use: typography debugging and license checks
- Animations inspector
- Timeline for CSS and Web Animations API; scrub, replay, slow motion
- Use: debug timing and easing, capture frames
- Web Console
- Logs, errors, warnings, network messages, DOM exceptions, CSS warnings
- Execute JS in page context, inspect objects and elements
- Use: quick evaluation, console.table, saving logs
- JavaScript Debugger
- Set breakpoints (line, conditional, XHR/fetch), step through, watch expressions, examine call stack and scopes
- Use: tracing runtime bugs, async stack traces, break on exceptions
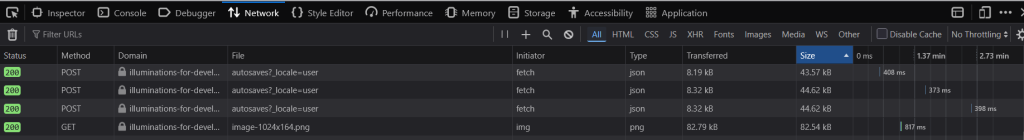
- Network Monitor
- Full request/response view, timings (DNS/connect/TLS/TTFB), size, initiator, priority, headers, preview/response body, throttling
- Use: asset optimization, caching issues, API debugging
- Performance (Profiler)
- Record frames, JavaScript CPU usage, paint/layout events, call trees, flame charts
- Use: find code hotspots, layout thrashing, long tasks causing jank
- Memory
- Heap snapshots, allocation stacks, retainers, detect leaks and high memory objects
- Use: reduce memory bloat, track closures holding DOM
- Storage / Application panel
- Inspect cookies, localStorage, sessionStorage, IndexedDB, Cache Storage, service workers
- Use: debug auth, caching strategies, stale content
- Responsive Design Mode
- Emulate device viewports, DPR, touch, UA, and network throttling
- Use: visual QA across screen sizes and simulated slow connections
- Accessibility Inspector
- Accessibility tree, computed name/role/state, contrast checker, ARIA properties
- Use: compliance checks, screen reader troubleshooting
- Security
- TLS/HTTPS status, mixed content, certificate info
- Use: detect insecure resources and certificate issues
- Application Security & Permissions
- Inspect permissions, feature policy, CSP violations in console
- Performance Tools for Graphics & Layers
- Paint flashing, layer borders and frame-rate diagnostics for heavy animations
Tips and tricks
- Use Ctrl/Cmd+F in Inspector to search HTML/CSS
- Right‑click a rule → Copy → Copy Rule or Copy Declaration to transfer fixes
- Use “Toggle Element State” to force :hover/:active/:focus states for testing
- Pin frequently used panels (three‑dot menu → Settings → Toolbox) to keep your layout
- Use multi‑selection (Shift/Ctrl) in Console for batch operations
- Persist logs across reloads (Console “Preserve log”) when debugging redirects or service worker registrations
- Throttle network to Slow 3G to surface timing bugs and lazy load problems early
- Use the “Disable Cache” option (Network panel) while DevTools is open to bypass cache during reloads
- Use pretty-print and source maps in Debugger for minified code
- Use conditional breakpoints to avoid noisy stepping in loops
- Use “Break on attribute mutation” or “Break on subtree modifications” in Inspector for dynamic DOM problems
- Use the “Take screenshot” and “Capture node screenshot” options in the Inspector for image assets or bug reports
Useful built‑in workflows
- Audit large page loads: open Network → sort by size/time → identify big assets → compress/serve smaller formats (WebP/AVIF), lazy load images and implement HTTP caching headers
- Find memory leaks: take two Heap snapshots before/after action, diff the snapshots and inspect retained DOM nodes and detached elements
- Speed up time‑to‑interactive: record Performance while loading, inspect long tasks and paint/layout recalc events, prioritize code splitting and defer non‑critical work
Add‑ons and external tools that pair well with Firefox DevTools
| Extension | Adds / Purpose | Use Cases |
|---|---|---|
| Web Developer (by Chris Pederick) | Extra toolbar of DOM/CSS utilities (disable styles, outline elements, forms tools) | Quick diagnostic actions and mass toggles |
| React Developer Tools | Inspect React component tree, props, state, hooks | Debug React structure and performance; integrates with DevTools profiler |
| Vue.js Devtools | Vue component inspector, performance | Vue SPA debugging and state inspection |
| Redux DevTools | Time‑travel debugging for Redux stores | For Redux-driven apps to replay actions and inspect state |
| Wappalyzer | Detect tech stack, frameworks, libs used | Quick reconnaissance and dependency checks |
| Lighthouse (via extension or CLI) | Automated performance/accessibility/SEO audits | High-level audits and actionable suggestions |
| ColorZilla / Eyedropper | Pick colors from the page and create palettes | Visual QA and color checks |
| HTTP Header Live / Modify Headers | View/modify request headers on the fly | Test CORS, security headers, feature detection |
| LiveReload / BrowserSync (local dev) | Auto-refresh and synced testing across devices | Rapid local development iteration |
| CSS Peeper | Read styles, fonts, assets in a friendly UI | Fast style extraction for design handoff |
Note: many capabilities (network, console, accessibility) already exist in DevTools. Some extensions mainly add framework-specific inspection, recon tools or UI conveniences
Accessibility and testing considerations
- Use the Accessibility Inspector to surface missing labels, roles and improper semantics
- Use color contrast tool in Accessibility panel. Fix low contrast by adjusting foreground/background or font weight
- Use keyboard testing (Tab order inspector) to ensure logical focus flow
- Test with a screen reader (NVDA/VoiceOver) where possible, the Accessibility Inspector helps but should not replace real assistive tech
Advanced topics & workflows
- Remote debugging: connect Firefox on Android or another desktop instance via about:debugging → connect and debug pages on the device
- Source maps & transpiled code: enable source maps in Debugger settings to step through original TypeScript or transpiled code
- Automating checks: combine Lighthouse, Puppeteer or Playwright tests to run performance/accessibility checks in CI
- Custom DevTools extensions: build an extension for a bespoke workflow (see “Extending DevTools” in Firefox docs)
- Network recording for reproducible bug reports: export HAR from Network Monitor to share with teammates
Common pitfalls and how to avoid them
- Caching hides changes, use “Disable cache” while DevTools is open
- Minified code without source maps, enable source maps or generate them in your build
- Over-reliance on developer mode alone — cross‑check in real devices and browsers
Resources and Official Docs
- Firefox DevTools docs: https://firefox-source-docs.mozilla.org/devtools/
- Lighthouse (audits): https://developers.google.com/web/tools/lighthouse
Leave a Reply
You must be logged in to post a comment.