This is a follow up on our previous firefox post so if you haven’t already read it check here for any questions. That is more of a detailed guide that can be used with chromium browsers as well with the key differences being noted below.
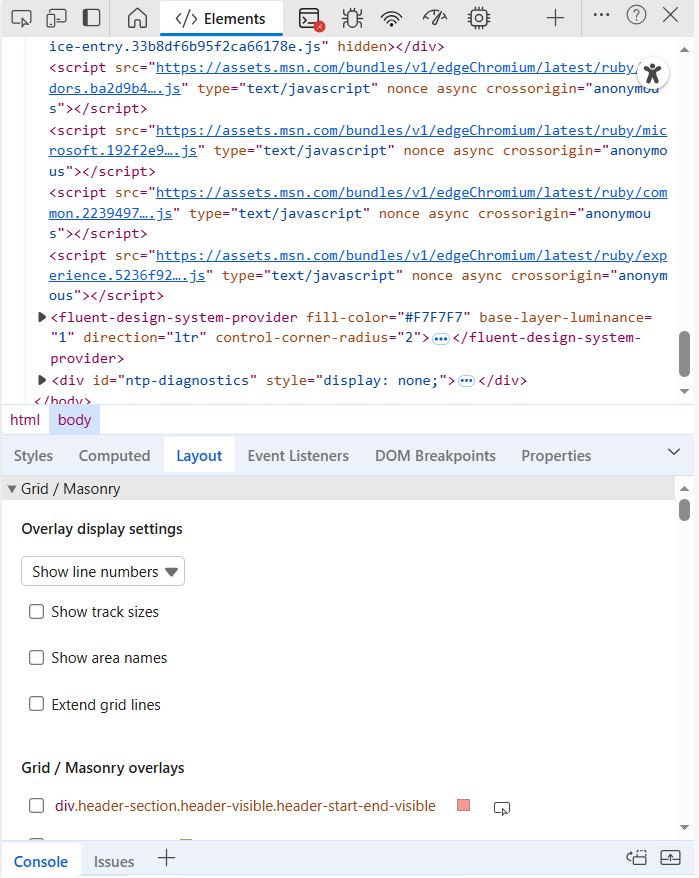
- CSS Grid & Flexbox visualization
- Firefox: stronger, more detailed Grid and Flexbox highlighters (interactive overlays, gap/line labels)
- Chromium: good visualizers but generally less feature-rich for grid diagnostics
- Layout & box-model UX
- Firefox: clearer box-model inspector and overlay controls for spacing troubleshooting
- Chromium: similar capabilities but different UI placement and terminology
- Performance tooling & profiler UI
- Firefox: comparable profiling features with different visualizations and emphasis on paint/layout diagnostics
- Chromium: integrated Lighthouse and early experimental features, flame charts and profiler UX differ
- Memory tools
- Firefox: robust heap snapshot and retainers view focused on DOM detachment patterns
- Chromium: allocation instrumentation and allocation profiler with different workflows for tracking leaks
- Issues / centralized warnings
- Firefox: reports many issues via Console and Security panels but lacks identical centralized Issues UI
- Chromium: built-in Issues panel aggregating CSP, deprecations, mixed content etc
- Rendering diagnostics (paint/layers)
- Firefox: paint flashing, layer borders and compositing tools with different visualization strengths
- Chromium: comparable rendering tools and an FPS meter, implementations and visuals differ
- Early experimental features
- Firefox: may lag on some experiments but offers unique UX strengths for CSS/layout.
- Chromium: often receives experimental DevTools features earlier (and integrates Lighthouse)
- Framework/extension ecosystem
- Firefox: supports major framework devtools but fewer third‑party DevTools extensions overall
- Chromium: broader extension availability (React/Vue tools, Lighthouse extension, many DevTools extensions)
- Remote debugging UX
- Firefox: about:debugging for remote devices; comparable but different workflow.
- Chromium: chrome://inspect for Android and a large ecosystem of remote/debugging tools
- Default privacy/telemetry posture
- Firefox: generally more privacy-forward in defaults (affects telemetry and some DevTools integrations)
- Chromium: more integrations and telemetry options enabled by default in many builds
- UI/interaction differences (short list)
- Panels naming: Elements (Chromium) vs. Inspector (Firefox)
- Device Mode (Chromium) vs. Responsive Design Mode (Firefox): similar features, different controls
- Console toggling and shortcuts are mostly the same but some keybindings and menu placements differ
Using both Chromium based browser and Firefox tools together
Use both toolchains when diagnosing cross‑browser issues. If you reproduce in both you can catch engine-specific rendering, layout or JS differences.
For example you can use the Elements/Inspector panels to compare computed styles, box‑model overlays and Grid/Flexbox highlighters to spot layout differences; toggle and edit CSS live in each to see engine‑specific rendering.
Capture network activity and HARs from both browsers to compare request timing, caching headers, and resource sizes, then run performance recordings (flame charts in Chrome, Performance/paint diagnostics in Firefox) to identify different long‑tasks, layout thrashing or paint costs.
Take heap snapshots or allocation profiles in each to detect memory leaks that may manifest differently across engines.
Run accessibility audits (Lighthouse in Chrome and the Accessibility Inspector in Firefox) and validate with a screen reader to surface divergent ARIA or focus issues.
Finally, reproduce fixes in both browsers and retest in Device/Responsive modes and on real devices via remote debugging (chrome://inspect and about:debugging) to ensure cross‑browser consistency.
Resources and links
- Chrome DevTools docs: https://developer.chrome.com/docs/devtools/
Leave a Reply
You must be logged in to post a comment.